Top of the South Forests
TOTS Forests, Forestry and Wood Processing
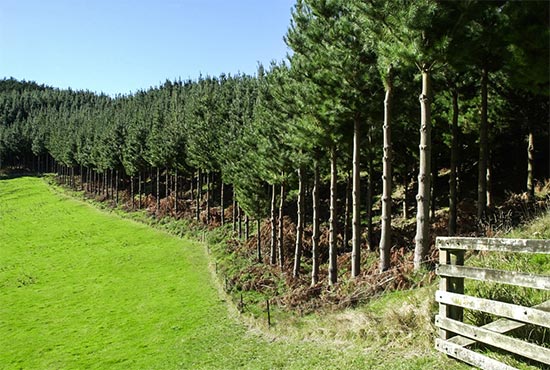
The temperate climate in the top of the south provides ideal growing conditions for our forest species. Forest ownership in the area is a mix of larger corporate and smaller, privately owned, forest estates and woodlots. Farming and forestry have traditionally been complementary land uses in the region, with forestry offering sheep and beef farmers the opportunity to diversify and enhance hill country and catchments.
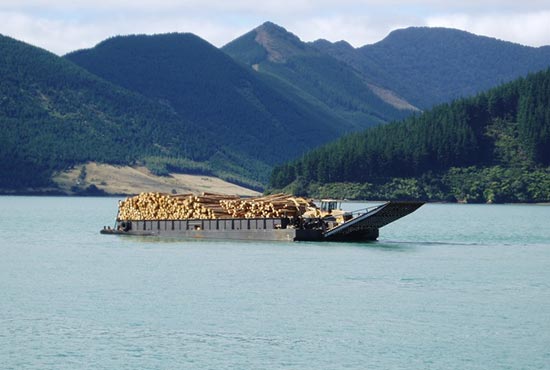
The top of the south is the only area in New Zealand where barges are used to transport logs from forests in the Marlborough Sounds, to either Port Marlborough for export or to log yards for transporting onto local sawmills for processing. In areas like the Marlborough Sounds, where access is either non-existent or challenging, barges provide a vital solution.


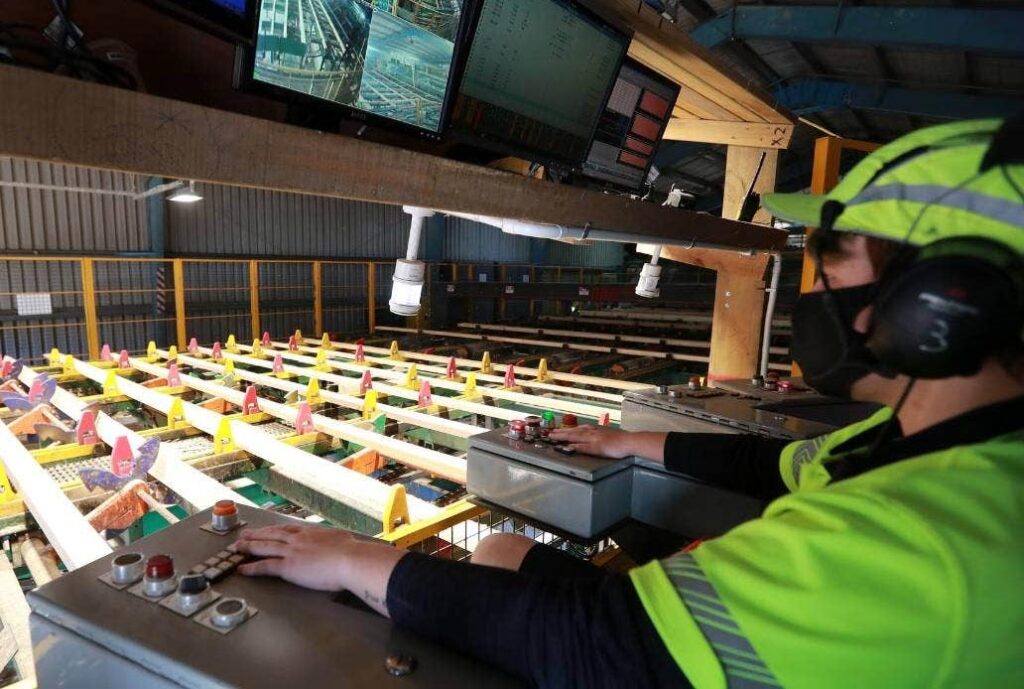
Along with growing the trees, the top of the south has numerous innovative wood processing facilities, as well as two export shipping ports. These include Picton’s Shakespeare Bay, the deepest water export shipping in New Zealand, and Port Nelson, from which logs, sawn and processed lumber is exported to markets all over the world.
Together our forests, wood processors and critical, associated, industries are helping to ensure a diverse and thriving, low emissions future for the top of the south.

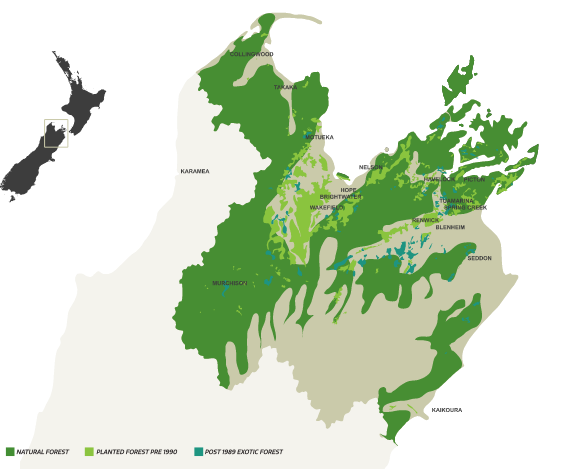
Forest Locations
Along with growing the trees, the top of the south has numerous innovative wood processing facilities, as well as two export shipping ports. These include Picton’s Shakespeare Bay, the deepest water export shipping in New Zealand, and Port Nelson, from which logs, sawn and processed lumber is exported to markets all over the world.
Together our forests, wood processors and critical, associated, industries are helping to ensure a diverse and thriving, low emissions future for the top of the south.
Planted Forest by Region
Area Planted in all Species by Territorial Authority
| Region | ||||
| 2019 | 2020 | 2021 | % | |
| Northland | 185,943 | 188,586 | 194,023 | 11% |
| Central North Island | 562,792 | 564,448 | 560,001 | 32% |
| East Coast | 155,617 | 155,359 | 157,295 | 9% |
| Hawke’s Bay | 131,733 | 131,994 | 139,558 | 8% |
| Southern North Island | 159,690 | 167,718 | 176,250 | 10% |
| Nelson/Marlborough | 165,077 | 164,639 | 167,920 | 10% |
| Canterbury | 94,782 | 96,721 | 95,278 | 5% |
| West Coast | 30,401 | 30,157 | 30,285 | 2% |
| Otago/Southland | 210,569 | 216,953 | 219,361 | 13% |
| Total | 1,696,604 | 1,716,575 | 1,739,971 | 100% |